Reading List
The most recent articles from a list of feeds I subscribe to.
Examples of problems with integers
Hello! A few days back we talked about problems with floating point numbers.
This got me thinking – but what about integers? Of course integers have all kinds of problems too – anytime you represent a number in a small fixed amount of space (like 8/16/32/64 bits), you’re going to run into problems.
So I asked on Mastodon again for examples of integer problems and got all kinds of great responses again. Here’s a table of contents.
example 1: the small database primary key
example 2: integer overflow/underflow
aside: how do computers represent negative integers?
example 3: decoding a binary format in Java
example 4: misinterpreting an IP address or string as an integer
example 5: security problems because of integer overflow
example 6: the case of the mystery byte order
example 7: modulo of negative numbers
example 8: compilers removing integer overflow checks
example 9: the && typo
Like last time, I’ve written some example programs to demonstrate these problems. I’ve tried to use a variety of languages in the examples (Go, Javascript, Java, and C) to show that these problems don’t just show up in super low level C programs – integers are everywhere!
Also I’ve probably made some mistakes in here, I learned several things while writing this.
example 1: the small database primary key
One of the most classic (and most painful!) integer problems is:
- You create a database table where the primary key is a 32-bit unsigned integer, thinking “4 billion rows should be enough for anyone!”
- You are massively successful and eventually, your table gets close to 4 billion rows
- oh no!
- You need to do a database migration to switch your primary key to be a 64-bit integer instead
If the primary key actually reaches its maximum value I’m not sure exactly what happens, I’d imagine you wouldn’t be able to create any new database rows and it would be a very bad day for your massively successful service.
example 2: integer overflow/underflow
Here’s a Go program:
package main

import "fmt"

func main() {
	var x uint32 = 5
	var length uint32 = 0
	if x < length-1 {
		fmt.Printf("%d is less than %d\n", x, length-1)
	}
}
This slightly mysteriously prints out:
5 is less than 4294967295
That true, but it’s not what you might have expected.
what’s going on?
0 - 1 is equal to the 4 bytes 0xFFFFFFFF.
There are 2 ways to interpret those 4 bytes:
- As a signed integer (-1)
- As an unsigned integer (4294967295)
Go here is treating length - 1 as a unsigned integer, because we defined x and length as uint32s (the “u” is for “unsigned”). So it’s testing if 5 is less than 4294967295, which it is!
what do we do about it?
I’m not actually sure if there’s any way to automatically detect integer overflow errors in Go. (though it looks like there’s a github issue from 2019 with some discussion)
Some brief notes about other languages:
- Lots of languages (Python, Java, Ruby) don’t have unsigned integers at all, so this specific problem doesn’t come up
- In C, you can compile with
clang -fsanitize=unsigned-integer-overflow. Then if your code has an overflow/underflow like this, the program will crash. - Similarly in Rust, if you compile your program in debug mode it’ll crash if there’s an integer overflow. But in release mode it won’t crash, it’ll just happily decide that 0 - 1 = 4294967295.
The reason Rust doesn’t check for overflows if you compile your program in release mode (and the reason C and Go don’t check) is that – these checks are expensive! Integer arithmetic is a very big part of many computations, and making sure that every single addition isn’t overflowing makes it slower.
aside: how do computers represent negative integers?
I mentioned in the last section that 0xFFFFFFFF can mean either -1 or
4294967295. You might be thinking – what??? Why would 0xFFFFFFFF mean -1?
So let’s talk about how computers represent negative integers for a second.
I’m going to simplify and talk about 8-bit integers instead of 32-bit integers, because there are less of them and it works basically the same way.
You can represent 256 different numbers with an 8-bit integer: 0 to 255
00000000 -> 0
00000001 -> 1
00000010 -> 2
...
11111111 -> 255
But what if you want to represent negative integers? We still only have 8 bits! So we need to reassign some of these and treat them as negative numbers instead.
Here’s the way most modern computers do it:
- Every number that’s 128 or more becomes a negative number instead
- How to know which negative number it is: take the positive integer you’d expect it to be, and then subtract 256
So 255 becomes -1, 128 becomes -128, and 200 becomes -56.
Here are some maps of bits to numbers:
00000000 -> 0
00000001 -> 1
00000010 -> 2
01111111 -> 127
10000000 -> -128 (previously 128)
10000001 -> -127 (previously 129)
10000010 -> -126 (previously 130)
...
11111111 -> -1 (previously 255)
This gives us 256 numbers, from -128 to 127.
And 11111111 (or 0xFF, or 255) is -1.
For 32 bit integers, it’s the same story, except it’s “every number larger than 2^31 becomes negative” and “subtract 2^32”. And similarly for other integer sizes.
That’s how we end up with 0xFFFFFFFF meaning -1.
there are multiple ways to represent negative integers
The way we just talked about of representing negative integers (“it’s the equivalent positive integer, but you subtract 2^n”) is called two’s complement, and it’s the most common on modern computers. There are several other ways though, the wikipedia article has a list.
weird thing: the absolute value of -128 is negative
This Go program has a pretty simple abs() function that computes the absolute value of an integer:
package main

import (
	"fmt"
)

func abs(x int8) int8 {
	if x < 0 {
		return -x
	}
	return x
}

func main() {
	fmt.Println(abs(-127))
	fmt.Println(abs(-128))
}
This prints out:
127
-128
This is because the signed 8-bit integers go from -128 to 127 – there is no +128! Some programs might crash when you try to do this (it’s an overflow), but Go doesn’t.
Now that we’ve talked about signed integers a bunch, let’s dig into another example of how they can cause problems.
example 3: decoding a binary format in Java
Let’s say you’re parsing a binary format in Java, and you want to get the first
4 bits of the byte 0x90. The correct answer is 9.
public class Main {
    public static void main(String[] args) {
        byte b = (byte) 0x90;
        System.out.println(b >> 4);
    }
}
This prints out “-7”. That’s not right!
what’s going on?
There are two things we need to know about Java to make sense of this:
- Java doesn’t have unsigned integers.
- Java can’t right shift bytes, it can only shift integers. So anytime you shift a byte, it has to be promoted into an integer.
Let’s break down what those two facts mean for our little calculation b >> 4:
- In bits,
0x90is10010000. This starts with a 1, which means that it’s more than 128, which means it’s a negative number - Java sees the
>>and decides to promote0x90to an integer, so that it can shift it - The way you convert a negative byte to an 32-bit integer is to add a bunch of
1s at the beginning. So now our 32-bit integer is0xFFFFFF90(Fbeing 15, or1111) - Now we right shift (
b >> 4). By default, Java does a signed shift, which means that it adds 0s to the beginning if it’s positive, and 1s to the beginning if it’s negative. (>>>is an unsigned shift in Java) - We end up with
0xFFFFFFF9(having cut off the last 4 bits and added more 1s at the beginning) - As a signed integer, that’s -7!
what can you do about it?
I don’t the actual idiomatic way to do this in Java is, but the way I’d naively approach fixing this is to put in a bit mask before doing the right shift. So instead of:
b >> 4
we’d write
(b & 0xFF) >> 4
b & 0xFF seems redundant (b is already a byte!), but it’s actually not because b is being promoted to an integer.
Now instead of 0x90 -> 0xFFFFFF90 -> 0xFFFFFFF9, we end up calculating 0x90 -> 0xFFFFFF90 -> 0x00000090 -> 0x00000009, which is the result we wanted: 9.
And when we actually try it, it prints out “9”.
Also, if we were using a language with unsigned integers, the natural way to deal with this would be to treat the value as an unsigned integer in the first place. But that’s not possible in Java.
example 4: misinterpreting an IP address or string as an integer
I don’t know if this is technically a “problem with integers” but it’s funny
so I’ll mention it: Rachel by the bay has a bunch of great
examples of things that are not integers being interpreted as integers. For
example, “HTTP” is 0x48545450 and 2130706433 is 127.0.0.1.
She points out that you can actually ping any integer, and it’ll convert that integer into an IP address, for example:
$ ping 2130706433
PING 2130706433 (127.0.0.1): 56 data bytes
$ ping 132848123841239999988888888888234234234234234234
PING 132848123841239999988888888888234234234234234234 (251.164.101.122): 56 data bytes
(I’m not actually sure how ping is parsing that second integer or why ping accepts these giant larger-than-2^64-integers as valid inputs, but it’s a fun weird thing)
example 5: security problems because of integer overflow
Another integer overflow example: here’s a search for CVEs involving integer overflows. There are a lot! I’m not a security person, but here’s one random example: this json parsing library bug
My understanding of that json parsing bug is roughly:
- you load a JSON file that’s 3GB or something, or 3,000,000,000
- due to an integer overflow, the code allocates close to 0 bytes of memory instead of ~3GB amount of memory
- but the JSON file is still 3GB, so it gets copied into the tiny buffer with almost 0 bytes of memory
- this overwrites all kinds of other memory that it’s not supposed to
The CVE says “This vulnerability mostly impacts process availability”, which I think means “the program crashes”, but sometimes this kind of thing is much worse and can result in arbitrary code execution.
My impression is that there are a large variety of different flavours of security vulnerabilities caused by integer overflows.
example 6: the case of the mystery byte order
One person said that they’re do scientific computing and sometimes they need to read files which contain data with an unknown byte order.
Let’s invent a small example of this: say you’re reading a file which contains 4
bytes - 00, 00, 12, and 81 (in that order), that you happen to know
represent a 4-byte integer. There are 2 ways to interpret that integer:
0x00001281(which translates to 4737). This order is called “big endian”0x81120000(which translates to 2165440512). This order is called “little endian”.
Which one is it? Well, maybe the file contains some metadata that specifies the
endianness. Or maybe you happen to know what machine it was generated on and
what byte order that machine uses. Or maybe you just read a bunch of values,
try both orders, and figure out which makes more sense. Maybe 2165440512 is too
big to make sense in the context of whatever your data is supposed to mean, or
maybe 4737 is too small.
A couple more notes on this:
- this isn’t just a problem with integers, floating point numbers have byte order too
- this also comes up when reading data from a network, but in that case the byte order isn’t a “mystery”, it’s just going to be big endian. But x86 machines (and many others) are little endian, so you have to swap the byte order of all your numbers.
example 7: modulo of negative numbers
This is more of a design decision about how different programming languages design their math libraries, but it’s still a little weird and lots of people mentioned it.
Let’s say you write -13 % 3 in your program, or 13 % -3. What’s the result?
It turns out that different programming languages do it differently, for
example in Python -13 % 3 = 2 but in Javascript -13 % 3 = -1.
There’s a table in this blog post that describes a bunch of different programming languages’ choices.
example 8: compilers removing integer overflow checks
We’ve been hearing a lot about integer overflow and why it’s bad. So let’s imagine you try to be safe and include some checks in your programs – after each addition, you make sure that the calculation didn’t overflow. Like this:
#include <stdio.h>

#define INT_MAX 2147483647

int check_overflow(int n) {
    n = n + 100;
    if (n + 100 < 0)
        return -1;
    return 0;
}

int main() {
    int result = check_overflow(INT_MAX);
    printf("%d\n", result);
}
check_overflow here should return -1 (failure), because INT_MAX + 100 is more than the maximum integer size.
$ gcc  check_overflow.c  -o check_overflow && ./check_overflow
-1
$ gcc -O3 check_overflow.c  -o check_overflow && ./check_overflow
0
That’s weird – when we compile with gcc, we get the answer we expected, but
with gcc -O3, we get a different answer. Why?
what’s going on?
My understanding (which might be wrong) is:
- Signed integer overflow in C is undefined behavior. I think that’s because different C implementations might be using different representations of signed integers (maybe they’re using one’s complement instead of two’s complement or something)
- “undefined behaviour” in C means “the compiler is free to do literally whatever it wants after that point” (see this post With undefined behaviour, anything is possible by Raph Levine for a lot more)
- Some compiler optimizations assume that undefined behaviour will never happen. They’re free to do this, because – if that undefined behaviour did happen, then they’re allowed to do whatever they want, so “run the code that I optimized assuming that this would never happen” is fine.
- So this
if (n + 100 < 0)check is irrelevant – if that did happen, it would be undefined behaviour, so there’s no need to execute the contents of that if statement.
So, that’s weird. I’m not going to write a “what can you do about it?” section here because I’m pretty out of my depth already.
I certainly would not have expected that though.
My impression is that “undefined behaviour” is really a C/C++ concept, and doesn’t exist in other languages in the same way except in the case of “your program called some C code in an incorrect way and that C code did something weird because of undefined behaviour”. Which of course happens all the time.
example 9: the && typo
This one was mentioned as a very upsetting bug. Let’s say you have two integers and you want to check that they’re both nonzero.
In Javascript, you might write:
if a && b {
    /* some code */
}
But you could also make a typo and type:
if a & b {
    /* some code */
}
This is still perfectly valid code, but it means something completely different
– it’s a bitwise and instead of a boolean and. Let’s go into a Javascript
console and look at bitwise vs boolean and for 9 and 4:
> 9 && 4
4
> 9 & 4
0
> 4 && 5
5
> 4 & 5
4
It’s easy to imagine this turning into a REALLY annoying bug since it would be
intermittent – often x & y does turn out to be truthy if x && y is truthy.
what to do about it?
For Javascript, ESLint has a no-bitwise check check), which requires you manually flag “no, I actually know what I’m doing, I want to do bitwise and” if you use a bitwise and in your code. I’m sure many other linters have a similar check.
that’s all for now!
There are definitely more problems with integers than this, but this got pretty long again and I’m tired of writing again so I’m going to stop :)
Examples of floating point problems
Hello! I’ve been thinking about writing a zine about how things are represented on computers in bytes, so I was thinking about floating point.
I’ve heard a million times about the dangers of floating point arithmetic, like:
- addition isn’t associative (
x + (y + z)is different from(x + y) + z) - if you add very big values to very small values, you can get inaccurate results (the small numbers get lost!)
- you can’t represent very large integers as floating numbers
- NaN/infinity values can propagate and cause chaos
- there are two zeros (+0 and -0), and they’re not represented the same way
- denormal/subnormal values are weird
But I find all of this a little abstract on its own, and I really wanted some specific examples of floating point bugs in real-world programs.
So I asked on Mastodon for examples of how floating point has gone wrong for them in real programs, and as always folks delivered! Here are a bunch of examples. I’ve also written some example programs for some of them to see exactly what happens. Here’s a table of contents:
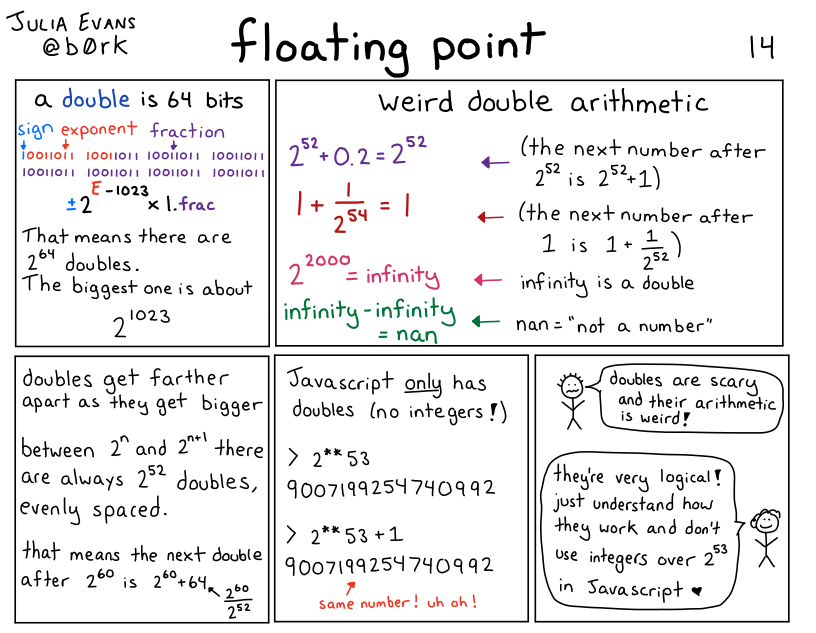
how does floating point work?
floating point isn’t “bad” or random
example 1: the odometer that stopped
example 2: tweet IDs in Javascript
example 3: a variance calculation gone wrong
example 4: different languages sometimes do the same floating point calculation differently
example 5: the deep space kraken
example 6: the inaccurate timestamp
example 7: splitting a page into columns
example 8: collision checking
None of these 8 examples talk about NaNs or +0/-0 or infinity values or subnormals, but it’s not because those things don’t cause problems – it’s just that I got tired of writing at some point :).
Also I’ve probably made some mistakes in this post.
how does floating point work?
I’m not going to write a long explanation of how floating point works in this post, but here’s a comic I wrote a few years ago that talks about the basics:
floating point isn’t “bad” or random
I don’t want you to read this post and conclude that floating point is bad. It’s an amazing tool for doing numerical calculations. So many smart people have done so much work to make numerical calculations on computers efficient and accurate! Two points about how all of this isn’t floating point’s fault:
- Doing numerical computations on a computer inherently involves some approximation and rounding, especially if you want to do it efficiently. You can’t always store an arbitrary amount of precision for every single number you’re working with.
- Floating point is standardized (IEEE 754), so operations like addition on floating point numbers are deterministic – my understanding is that 0.1 + 0.2 will always give you the exact same result (0.30000000000000004), even across different architectures. It might not be the result you expected, but it’s actually very predictable.
My goal for this post is just to explain what kind of problems can come up with floating point numbers and why they happen so that you know when to be careful with them, and when they’re not appropriate.
Now let’s get into the examples.
example 1: the odometer that stopped
One person said that they were working on an odometer that was continuously adding small amounts to a 32-bit float to measure distance travelled, and things went very wrong.
To make this concrete, let’s say that we’re adding numbers to the odometer 1cm at a time. What does it look like after 10,000 kilometers?
Here’s a C program that simulates that:
#include <stdio.h>
int main() {
    float meters = 0;
    int iterations = 100000000;
    for (int i = 0; i < iterations; i++) {
        meters += 0.01;
    }
    printf("Expected: %f km\n", 0.01 * iterations / 1000 );
    printf("Got: %f km \n", meters / 1000);
}
and here’s the output:
Expected: 10000.000000 km
Got: 262.144012 km
This is VERY bad – it’s not a small error, 262km is a LOT less than 10,000km. What went wrong?
what went wrong: gaps between floating point numbers get big
The problem in this case is that, for 32-bit floats, 262144.0 + 0.01 = 262144.0. So it’s not just that the number is inaccurate, it’ll actually never increase at all! If we travelled another 10,000 kilometers, the odometer would still be stuck at 262144 meters (aka 262.144km).
Why is this happening? Well, floating point numbers get farther apart as they get bigger. In this example, for 32-bit floats, here are 3 consecutive floating point numbers:
- 262144.0
- 262144.03125
- 262144.0625
I got those numbers by going to https://float.exposed/0x48800000 and incrementing the ‘significand’ number a couple of times.
So, there are no 32-bit floating point numbers between 262144.0 and 262144.03125. Why is that a problem?
The problem is that 262144.03125 is about 262144.0 + 0.03. So when we try to add 0.01 to 262144.0, it doesn’t make sense to round up to the next number. So the sum just stays at 262144.0.
Also, it’s not a coincidence that 262144 is a power of 2 (it’s 2^18). The gaps been floating point numbers change after every power of 2, and at 2^18 the gap between 32-bit floats is 0.03125, increasing from 0.016ish.
one way to solve this: use a double
Using a 64-bit float fixes this – if we replace float with double in the above C program, everything works a lot better. Here’s the output:
Expected: 10000.000000 km
Got: 9999.999825 km
There are still some small inaccuracies here – we’re off about 17 centimeters. Whether this matters or not depends on the context: being slightly off could very well be disastrous if we were doing a precision space maneuver or something, but it’s probably fine for an odometer.
Another way to improve this would be to increment the odometer in bigger chunks – instead of adding 1cm at a time, maybe we could update it less frequently, like every 50cm.
If we use a double and increment by 50cm instead of 1cm, we get the exact correct answer:
Expected: 10000.000000 km
Got: 10000.000000 km
A third way to solve this could be to use an integer: maybe we decide that the smallest unit we care about is 0.1mm, and then measure everything as integer multiples of 0.1mm. I have never built an odometer so I can’t say what the best approach is.
example 2: tweet IDs in Javascript
Javascript only has floating point numbers – it doesn’t have an integer type. The biggest integer you can represent in a 64-bit floating point number is 2^53.
But tweet IDs are big numbers, bigger than 2^53. The Twitter API now returns them as both integers and strings, so that in Javascript you can just use the string ID (like “1612850010110005250”), but if you tried to use the integer version in JS, things would go very wrong.
You can check this yourself by taking a tweet ID and putting it in the Javascript console, like this:
>> 1612850010110005250
   1612850010110005200
Notice that 1612850010110005200 is NOT the same number as 1612850010110005250!! It’s 50 less!
This particular issue doesn’t happen in Python (or any other language that I know of), because Python has integers. Here’s what happens if we enter the same number in a Python REPL:
In [3]: 1612850010110005250
Out[3]: 1612850010110005250
Same number, as you’d expect.
example 2.1: the corrupted JSON data
This is a small variant of the “tweet IDs in Javascript” issue, but even if you’re not actually writing Javascript code, numbers in JSON are still sometimes treated as if they’re floats. This mostly makes sense to me because JSON has “Javascript” in the name, so it seems reasonable to decode the values the way Javascript would.
For example, if we pass some JSON through jq, we see the exact same issue:
the number 1612850010110005250 gets changed into 1612850010110005200.
$ echo '{"id": 1612850010110005250}' | jq '.'
{
  "id": 1612850010110005200
}
But it’s not consistent across all JSON libraries Python’s json module will decode 1612850010110005250 as the correct integer.
Several people mentioned issues with sending floats in JSON, whether either they were trying to send a large integer (like a pointer address) in JSON and it got corrupted, or sending smaller floating point values back and forth repeatedly and the value slowly diverging over time.
example 3: a variance calculation gone wrong
Let’s say you’re doing some statistics, and you want to calculate the variance of many numbers. Maybe more numbers than you can easily fit in memory, so you want to do it in a single pass.
There’s a simple (but bad!!!) algorithm you can use to calculate the variance in a single pass, from this blog post. Here’s some Python code:
def calculate_bad_variance(nums):
    sum_of_squares = 0
    sum_of_nums = 0
    N = len(nums)
    for num in nums:
        sum_of_squares += num**2
        sum_of_nums += num
    mean = sum_of_nums / N
    variance = (sum_of_squares - N * mean**2) / N

    print(f"Real variance: {np.var(nums)}")
    print(f"Bad variance: {variance}")
First, let’s use this bad algorithm to calculate the variance of 5 small numbers. Everything looks pretty good:
In [2]: calculate_bad_variance([2, 7, 3, 12, 9])
Real variance: 13.84
Bad variance: 13.840000000000003 <- pretty close!
Now, let’s try it the same 100,000 large numbers that are very close together (distributed between 100000000 and 100000000.06)
In [7]: calculate_bad_variance(np.random.uniform(100000000, 100000000.06, 100000))
Real variance: 0.00029959105209321173
Bad variance: -138.93632 <- OH NO
This is extremely bad: not only is the bad variance way off, it’s NEGATIVE! (the variance is never supposed to be negative, it’s always zero or more)
what went wrong: catastrophic cancellation
What’s going here is similar to our odometer number problem: the
sum_of_squares number gets extremely big (about 10^21 or 2^69), and at that point, the
gap between consecutive floating point numbers is also very big – it’s 2**46.
So we just lose all precision in our calculations.
The term for this problem is “catastrophic cancellation” – we’re subtracting two very large floating point numbers which are both going to be pretty far from the correct value of the calculation, so the result of the subtraction is also going to be wrong.
The blog post I mentioned before talks about a better algorithm people use to compute variance called Welford’s algorithm, which doesn’t have the catastrophic cancellation issue.
And of course, the solution for most people is to just use a scientific computing library like Numpy to calculate variance instead of trying to do it yourself :)
example 4: different languages sometimes do the same floating point calculation differently
A bunch of people mentioned that different platforms will do the same calculation in different ways. One way this shows up in practice is – maybe you have some frontend code and some backend code that do the exact same floating point calculation. But it’s done slightly differently in Javascript and in PHP, so you users end up seeing discrepancies and getting confused.
In principle you might think that different implementations should work the same way because of the IEEE 754 standard for floating point, but here are a couple of caveats that were mentioned:
- math operations in libc (like sin/log) behave differently in different implementations. So code using glibc could give you different results than code using musl
- some x86 instructions can use 80 bit precision for some double operations internally instead of 64 bit precision. Here’s a GitHub issue talking about that
I’m not very sure about these points and I don’t have concrete examples I can reproduce.
example 5: the deep space kraken
Kerbal Space Program is a space simulation game, and it used to have a bug called the Deep Space Kraken where when you moved very fast, your ship would start getting destroyed due to floating point issues. This is similar to the other problems we’ve talked out involving big floating numbers (like the variance problem), but I wanted to mention it because:
- it has a funny name
- it seems like a very common bug in video games / astrophysics / simulations in general – if you have points that are very far from the origin, your math gets messed up
Another example of this is the Far Lands in Minecraft.
example 6: the inaccurate timestamp
I promise this is the last example of “very large floating numbers can ruin your day”. But! Just one more! Let’s imagine that we try to represent the current Unix epoch in nanoseconds (about 1673580409000000000) as a 64-bit floating point number.
This is no good! 1673580409000000000 is about 2^60 (crucially, bigger than 2^53), and the next 64-bit float after it is 1673580409000000256.
So this would be a great way to end up with inaccuracies in your time math. Of course, time libraries actually represent times as integers, so this isn’t usually a problem. (there’s always still the year 2038 problem, but that’s not related to floats)
In general, the lesson here is that sometimes it’s better to use integers.
example 7: splitting a page into columns
Now that we’ve talked about problems with big floating point numbers, let’s do a problem with small floating point numbers.
Let’s say you have a page width, and a column width, and you want to figure out:
- how many columns fit on the page
- how much space is left over
You might reasonably try floor(page_width / column_width) for the first
question and page_width % column_width for the second question. Because
that would work just fine with integers!
In [5]: math.floor(13.716 / 4.572)
Out[5]: 3

In [6]: 13.716 % 4.572
Out[6]: 4.571999999999999
This is wrong! The amount of space left is 0!
A better way to calculate the amount of space left might have been
13.716 - 3 * 4.572, which gives us a very small negative number.
I think the lesson here is to never calculate the same thing in 2 different ways with floats.
This is a very basic example but I can kind of see how this would create all kinds of problems if I was doing page layout with floating point numbers, or doing CAD drawings.
example 8: collision checking
Here’s a very silly Python program, that starts a variable at 1000 and
decrements it until it collides with 0. You can imagine that this is part of a
pong game or something, and that a is a ball that’s supposed to collide with
a wall.
a = 1000
while a != 0:
    a -= 0.001
You might expect this program to terminate. But it doesn’t! a is never 0,
instead it goes from 1.673494676862619e-08 to -0.0009999832650532314.
The lesson here is that instead of checking for float equality, usually you
want to check if two numbers are different by some very small amount. Or here
we could just write while a > 0.
that’s all for now
I didn’t even get to NaNs (the are so many of them!) or infinity or +0 / -0 or subnormals, but we’ve already written 2000 words and I’m going to just publish this.
I might write another followup post later – that Mastodon thread has literally 15,000 words of floating point problems in it, there’s a lot of material! Or I might not, who knows :)
Some business graphs for 2022
Hello! I like looking at other independent authors’ business graphs, so I thought I’d share some percentages and graphs of my own this year. Hopefully some of this is useful to other writers who run internet businesses.
All of the graphs are about Wizard Zines’ business selling zines – I don’t do sponsorships or consulting or commissions or anything.
print vs digital sales
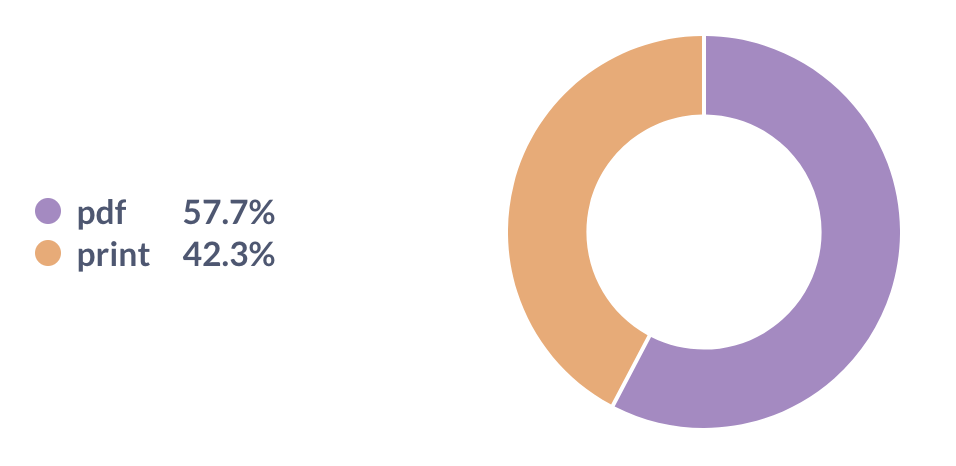
This year 58% of sales were digital and 42% were print. I’m really happy with this: when I decided to start printing and shipping zines in 2021, I was a bit worried that nobody would buy them. But we’ve sold out our first two print runs and it’s been going great.
Note: PDF means “PDF you can read on your computer or print at home”, print means “print version that’s physically shipped to you”
corporate vs personal sales
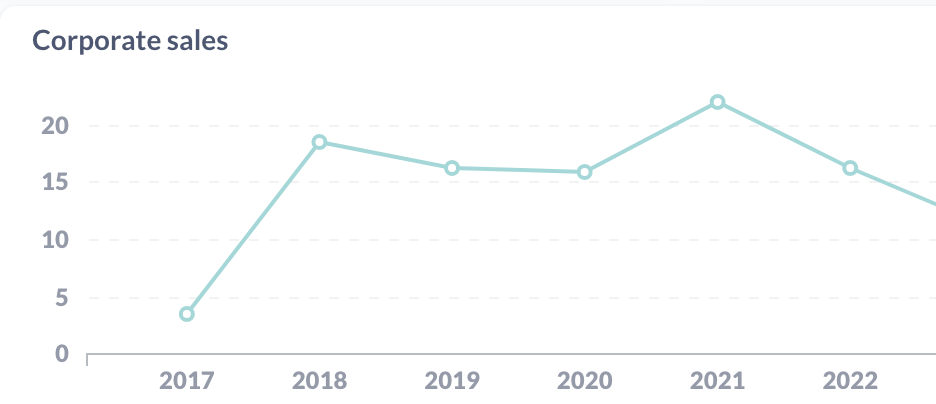
I sell both corporate licenses (“buy this zine for your team!”) and personal copies. I think having corporate sales is great, but it feels like it would be risky to be too dependent on a small number of corporate customers. So I keep an eye on the percentage of corporate sales.
We’re at about 16% corporate sales for 2022 (as a percentage of revenue), which doesn’t seem too high. It looks like this number has been pretty flat over time.
PPP sales
I run a PPP (“purchasing power parity”) program where I give a discount to folks from countries with a weaker currency relative to the US. We’ll look at a couple of things here:
- How many different countries are represented?
- Which countries are the biggest users of PPP?
- What percentage of revenue is from these sales?
Here are some graphs:
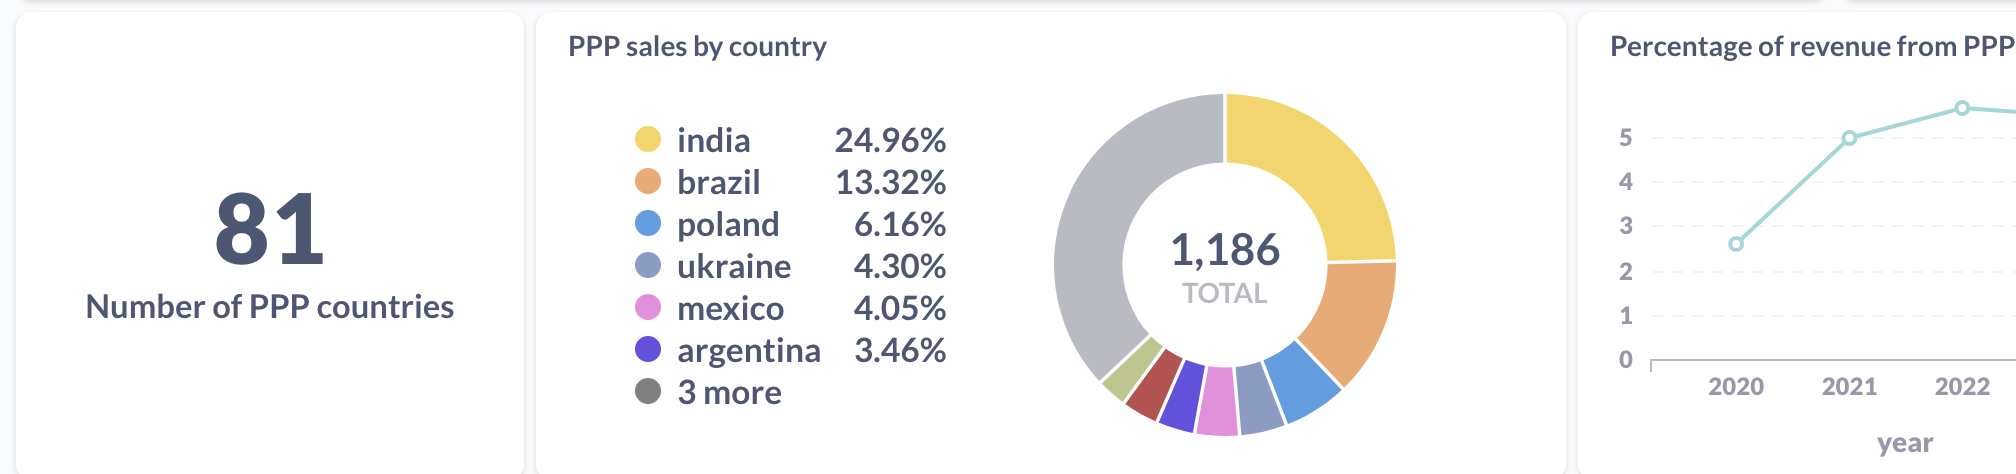
People from 81 different countries used the program (so many!!), and the biggest two users are India and Brazil. This has been the case as long as I can remember, presumably because India and Brazil are two of the biggest countries in the world.
About 5% of revenue comes from sales with PPP discounts.
bundles vs individual zines
It used to be that you could only buy individual zines on the store – if you wanted to buy a bundle, you had to buy each one individually. But then one day someone suggested I add a way to buy all of the zines at once.
I did, and this turned out to be a very important business decision – here’s a graph of the percentage of revenue from zine bundles (“packs”) over time:
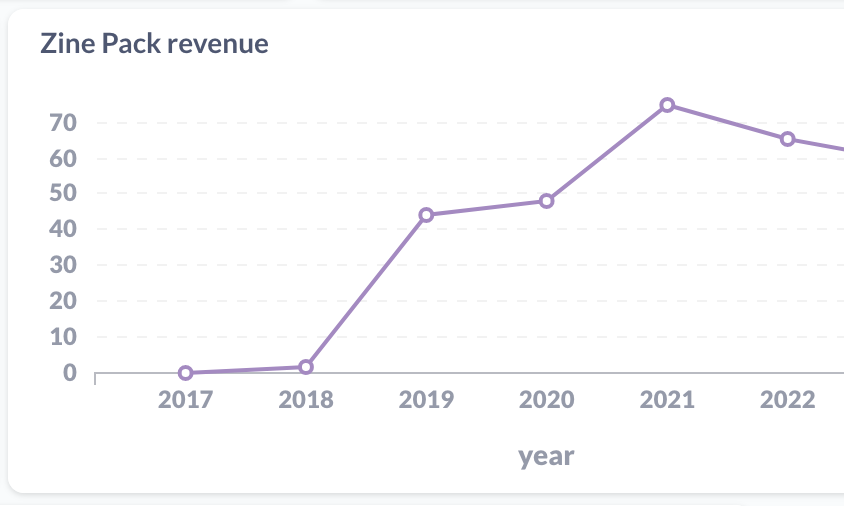
In 2022 it was 65% of revenue (up from 3% in 2018, which I guess is when I added zine packs for the first time).
platforms
I used to sell everything on Gumroad, now I sell everything on Shopify.
I could include some graphs here, but I think it’s not that interesting – it’s mostly a slow migration from 2020 to 2023, where 2020 was 100% Gumroad and 2023 is 100% Shopify.
Some reasons I switched to Shopify:
- I need to sell print zines, and Shopify has inventory management. Also the amazing fulfillment company I use (White Squirrel) uses a Shopify plugin.
- Since I needed to be using Shopify anyway for print zines, it felt easier to have everything on one platform.
- Right now Gumroad charges 10% (7% + processing fees), and Shopify charges $38/month plus processing fees. I actually pay more like $150/month including various Shopify plugins, but for me $150/month is a lot less than 7% of revenue.
Moving from Gumroad to Shopify took probably a month of energy in 2022 but it was worth it to have everything in one place.
revenue graph for 2020-2022
Here’s a graph of (relative) revenue. The blue and the purple are Shopify / Gumroad percentages, because of the Gumroad -> Shopify migration I mentioned in 2021 and 2022.
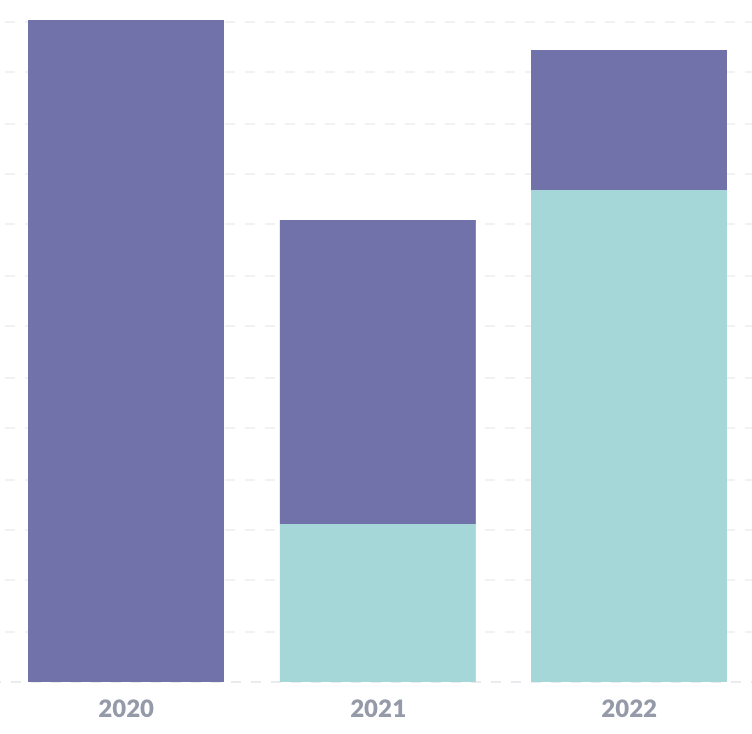
You can see that revenue for 2022 was less than 2020, but quite a bit more than 2021.
This is related to the number of zines released each year:
- 2 zines in 2022 (The Pocket Guide to Debugging and How DNS Works), but only 1
- 1 zine in 2021 (Bite Size Bash)
- 3 zines in 2020 (Become a SELECT Star, How Containers Work, Hell Yes! CSS!)
I put this towards the end because this is not something I try not to worry about too much – every year so far the business has made comfortably enough to pay everyone. If that looks like it might change, I’ll worry about it.
revenue by month
Here’s a graph of revenue by month for 2022 (and the first month of 2023 so far).
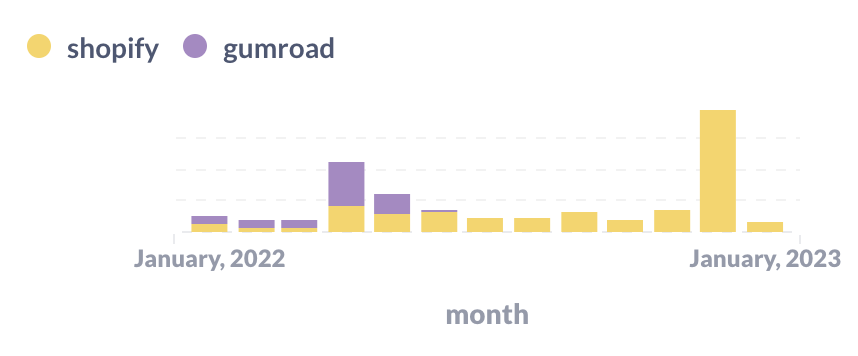
You can see two giant spikes: in April and December when we released new zines. (The Pocket Guide to Debugging has done super well so far, thanks to all of you who bought it! Print copies are on track to ship around the end of January.).
You can also see the Shopify / Gumroad migration happening in this graph – in May I stopped using Gumroad completely.
revenue by country
I got curious about which countries most sales come from, so I drew a graph. I combined the EU into one big group because there are a lot of European countries and I do a lot of special case stuff for Europe (for tax issues etc). Here’s the graph:
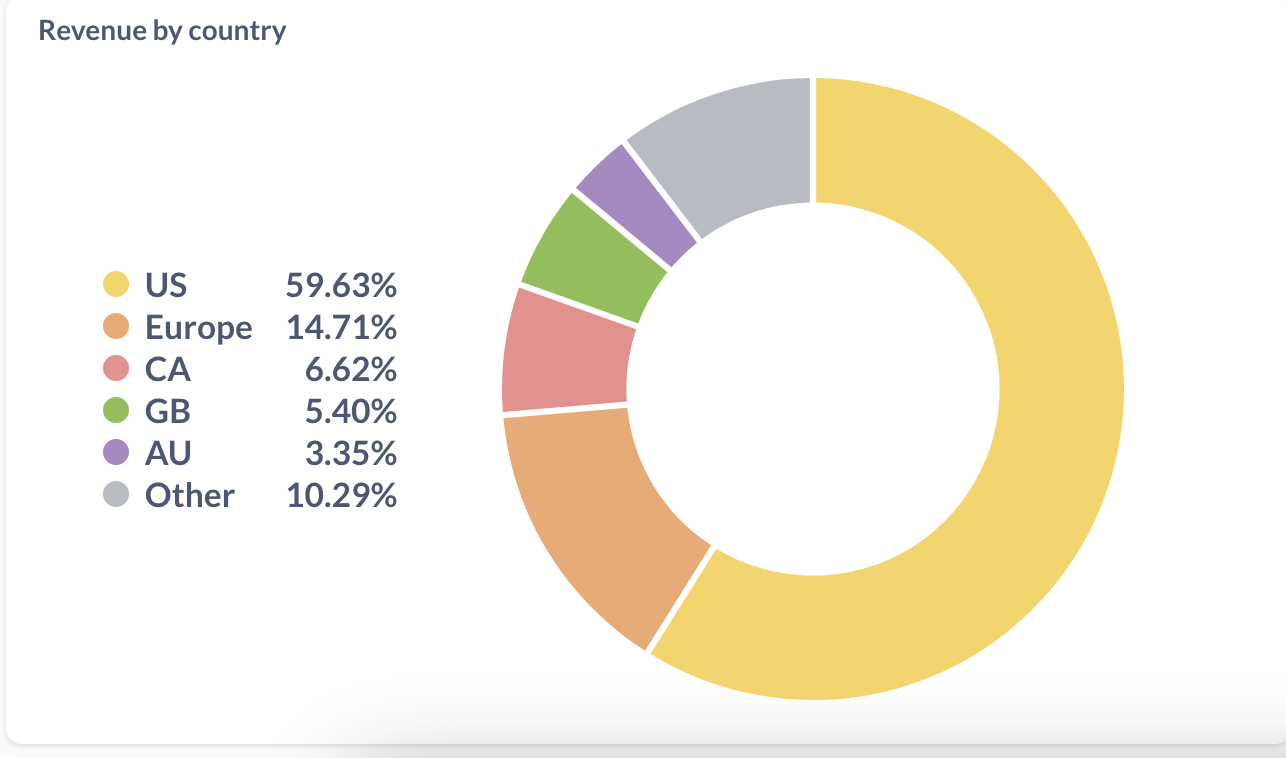
In numbers, that’s:
- US: 59.63%
- Europe: 14.71%
- Canada: 6.62%
- UK: 5.40%
- Australia: 3.35%
- Other: 10.29% (there are 117 countries in there)
Mostly what this tells me is that 40% of revenue comes from outside of the US – that’s a lot! I already offer free international shipping for large orders, but it makes me want to figure out if it’s possible to improve the international shipping situation for small orders too.
If we look at copies by country instead of revenue, this looks a bit different – India and Brazil are both above Australia.
more country data
Here’s a more detailed list of revenue percentages per country, if you want to break that “Europe” category above down more.
- US: 59.65%
- Canada: 6.57%
- United Kingdom: 5.43%
- Germany: 4.81%
- Australia: 3.34%
- France: 1.85%
- Netherlands: 1.58%
- India: 1.41%
- South Africa: 1.3%
- Switzerland: 1.15%
- Spain: 0.88%
- Sweden: 0.87%
- Brazil: 0.85%
- New Zealand: 0.82%
- Ireland: 0.7%
- Singapore: 0.64%
- Poland: 0.62%
- Norway: 0.61%
- Belgium: 0.5%
- Italy: 0.43%
- Finland: 0.42%
- Austria: 0.39%
- Denmark: 0.35%
- Portugal: 0.34%
- Mexico: 0.32%
And the full list of 126 countries where customers came from this year is: Canada, United States, Australia, Netherlands, United Kingdom, Denmark, Austria, Belgium, Spain, Mexico, Italy, Greece, France, Sweden, Finland, Germany, New Zealand, Switzerland, Malaysia, Norway, Israel, India, Iceland, Ireland, Portugal, China, Brazil, Argentina, Colombia, Czechia, Poland, Chile, Saudi Arabia, Bangladesh, Thailand, Belarus, Georgia, South Africa, Serbia, Kenya, Slovenia, Taiwan, Indonesia, Russia, Bhutan, Lithuania, Nigeria, Singapore, Maldives, Morocco, Japan, Sri Lanka, Romania, Egypt, Turkey, El Salvador, Estonia, United Arab Emirates, Malta, Vietnam, Ukraine, Macao, Croatia, Latvia, Jamaica, Iraq, Slovakia, Algeria, Philippines, Ecuador, Cyprus, Bulgaria, Jordan, Montenegro, Pakistan, Hungary, South Korea, Kyrgyzstan, Costa Rica, Ghana, Armenia, Peru, Hong Kong, Kazakhstan, Mongolia, Tunisia, Uruguay, Madagascar, Guatemala, Afghanistan, Angola, Bolivia, Uganda, Tanzania, Venezuela, Dominican Republic, Nepal, Réunion, Antigua and Barbuda, Qatar, Gibraltar, Azerbaijan, Guinea, Moldova, Sudan, Bahamas, Sierra Leone, Seychelles, Pitcairn, Uzbekistan, Bosnia and Herzegovina, Cambodia, Rwanda, Honduras, Benin, Kuwait, Cameroon, Puerto Rico, Turks and Caicos, Trinidad and Tobago, Senegal, North Macedonia, Botswana, Mauritius, Nicaragua.
It’s fun to see so many countries on the list!
how were the graphs generated?
One person asked how these graphs were generated. Basically I have:
- a “data warehouse” (a small 100MB SQLite database)
- a few scripts that use sqlite-utils to import data from the Shopify / Gumroad APIs into the “warehouse”, that run in a cron job on my laptop
- one view that combines my Gumroad sales and Shopify sales into a single table called
all_sales - a Metabase installation on my laptop where I can write SQL to make dashboards and graphs. Metabase is an open source BI tool.
This setup has worked great, I really like Metabase. All of the graphs are screenshots from Metabase.
people
Finally, I want to thank everyone who worked with me on the zines this year. I couldn’t do it without them. We had:
- Marie Claire LeBlanc Flanagan (we worked together on writing pretty much every weekday in 2022)
- Dolly Lanuza (editing)
- Gersande La Flèche (copy editing)
- Vladimir Kašiković (cover illustration)
- All of the beta readers who read and commented on early versions of the zines
- The team at White Squirrel (fulfillment/shipping)
- The team at Girlie Press (printing)
Also my partner Kamal reads every zine before it’s published and he always gives me great advice.
And of course I couldn’t do any of this without the readers who support all of this work ❤.
New zine: The Pocket Guide to Debugging
Hello! On Monday, we released a new zine: The Pocket Guide to Debugging! It has 47 of my favourite strategies for solving your sneakiest bugs.
You can get it for $12 here: https://wizardzines.com/zines/debugging-guide, or get an 12-pack of all my zines here.
Here’s the cover:

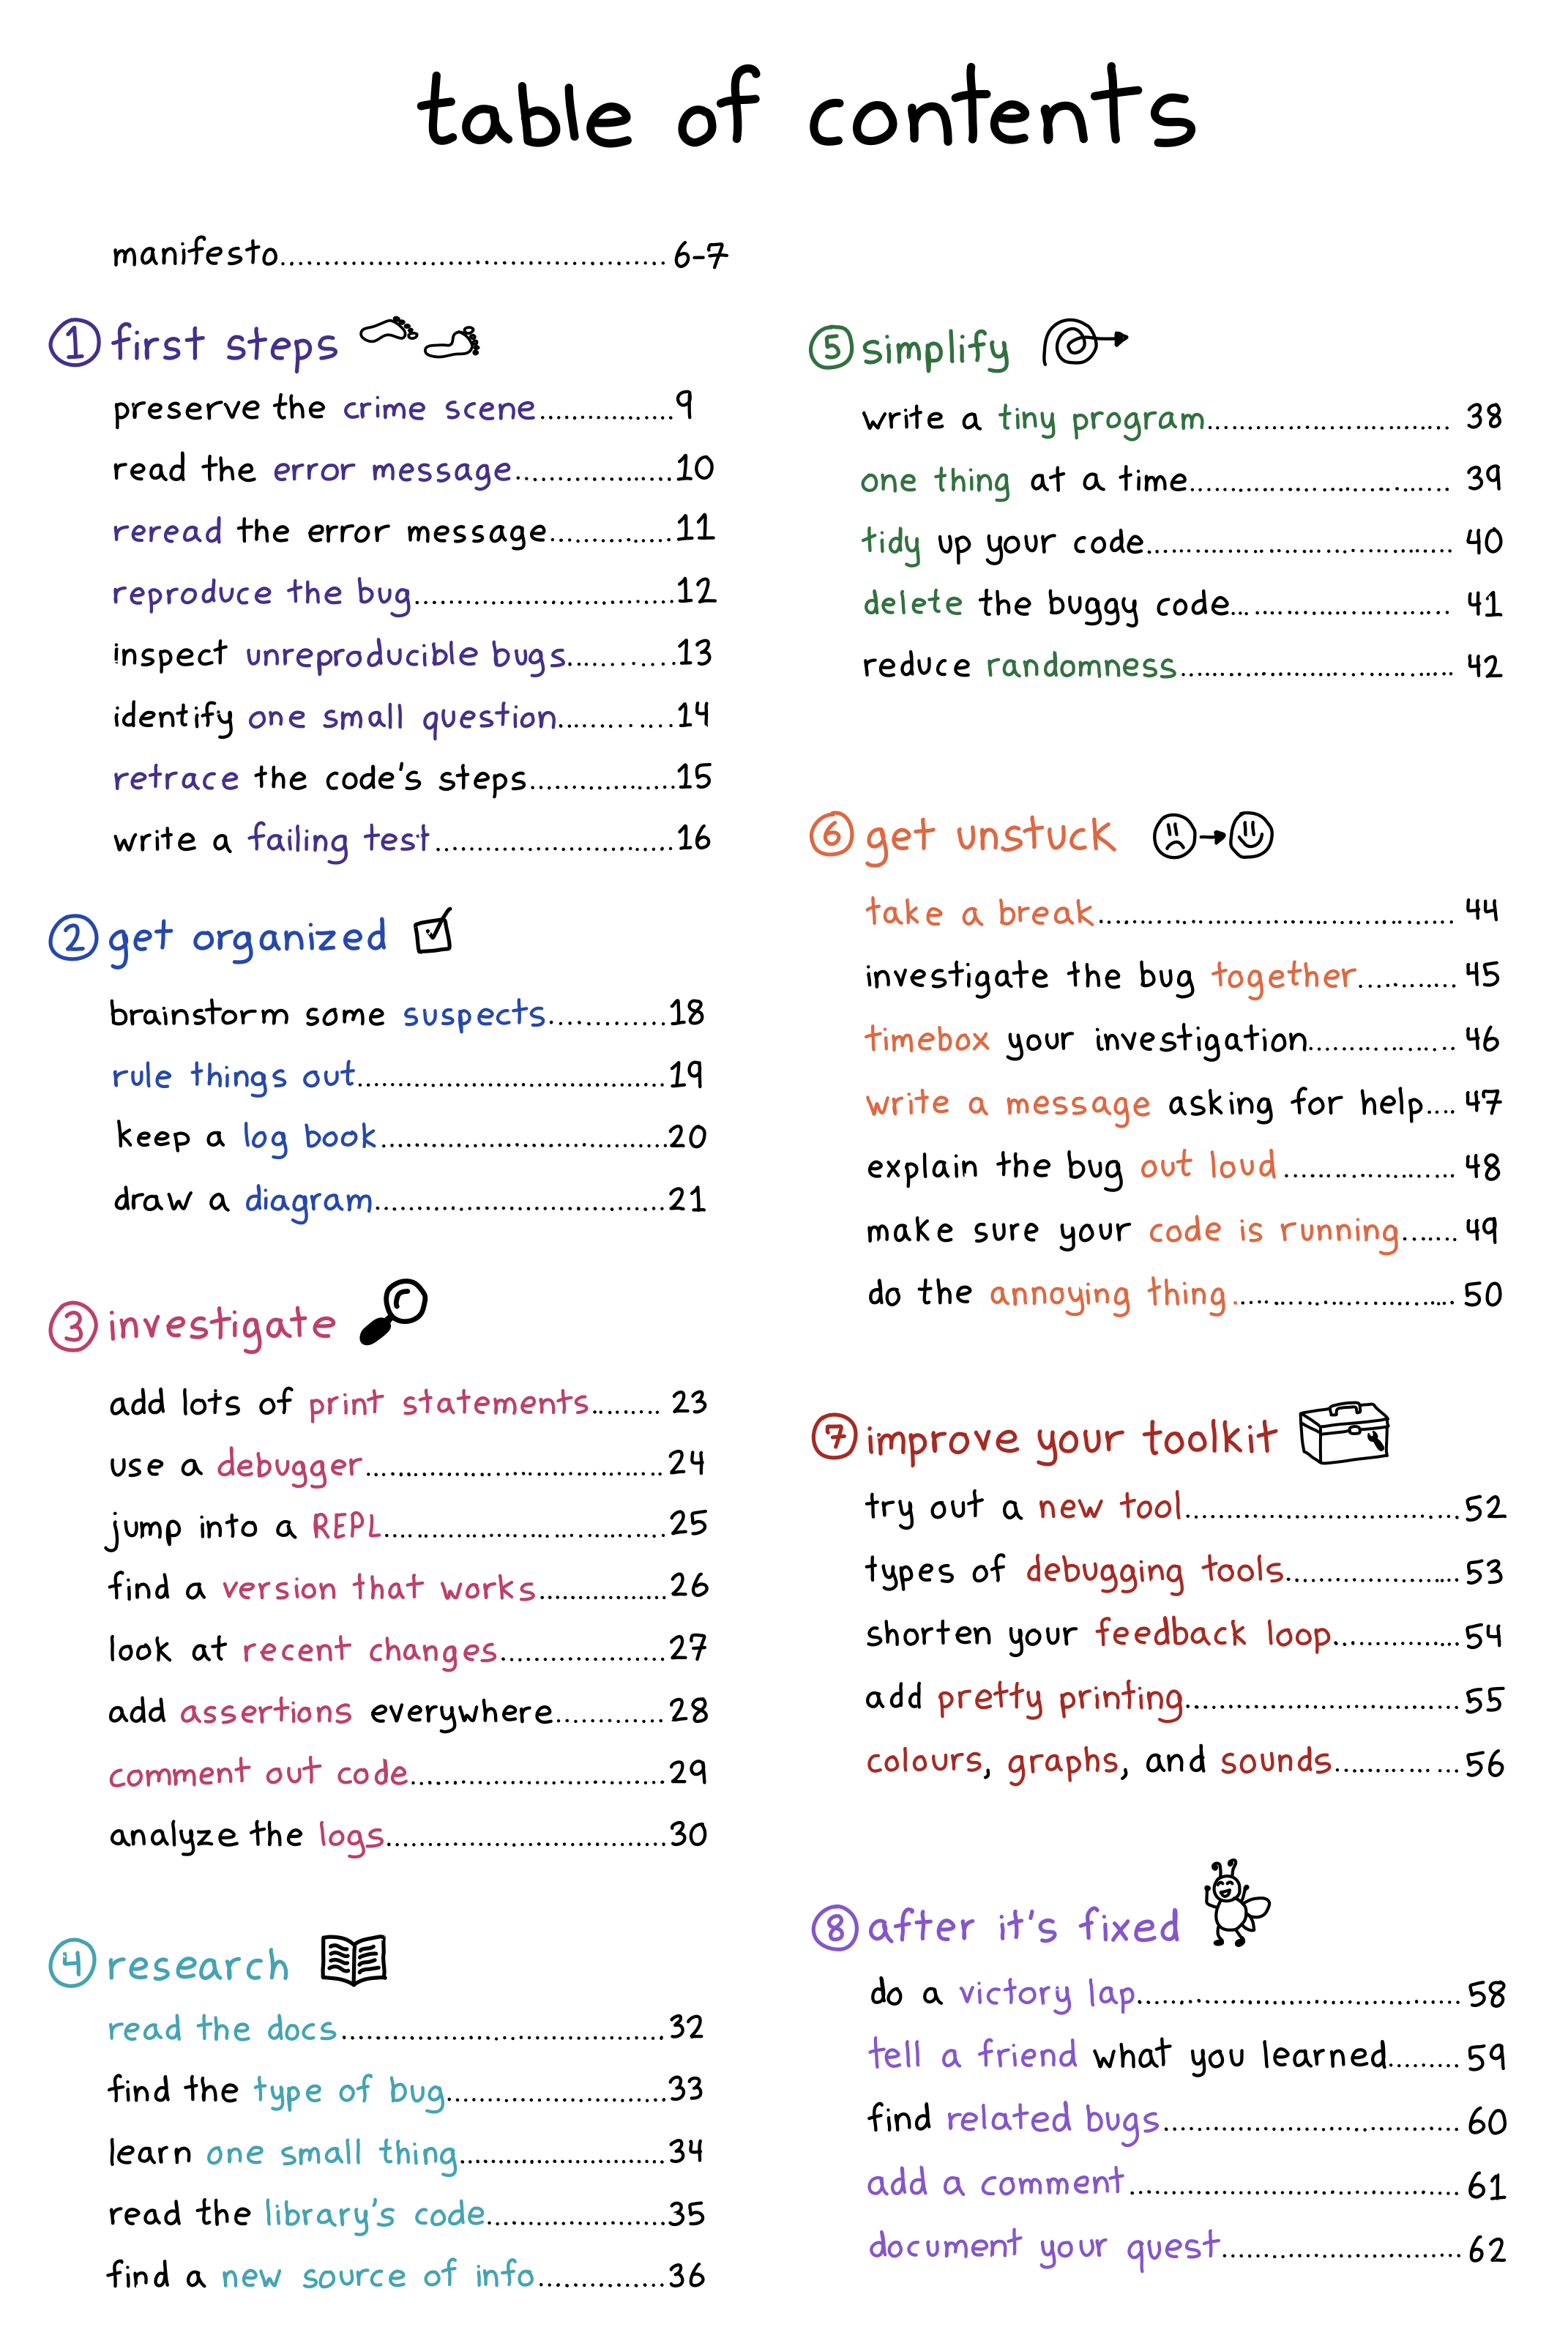
the table of contents
Here’s the table of contents!
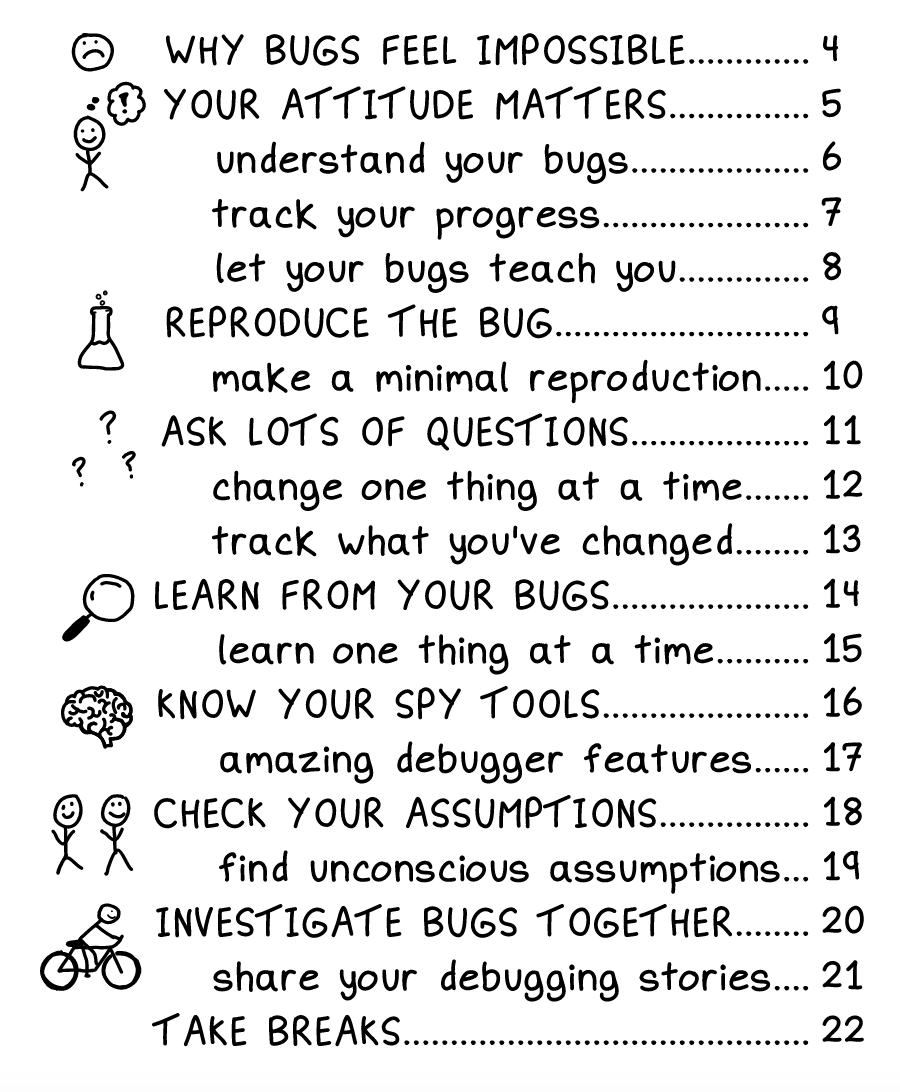
A few people mentioned that they were printing it out, so I made a PDF poster version if you want to print it:
I love that the table of contents is already kind of useful as a collection of strategies on its own.
why debugging?
I wrote this zine because debugging is a huge part of how we spend our time as programmers, but nobody teaches us how to do it! If you’re lucky, you get to pair program with someone who’s good at debugging and explaining their thought processes, and they can show you. But not all of us have that person, so we end up just struggling through it ourselves and learning strategies the hard way.
So I wanted to write a zine where beginners can learn some of these strategies the easy way, and which more experienced programmers can use as a reference to get ideas when you’re in the middle of a tricky bug.
it comes with some debugging mysteries!
This zine comes with a few choose-your-own-adventure debugging mysteries (like “The Case of the Connection Timeout”), at https://mysteries.wizardzines.com.
These mysteries show you how to apply some of the tricks in the zine to a specific kind of bug: computer networking issues! It also demos some of my favourite networking spy tools – it’ll show you some tips for interpreting their output.
You can read some notes on designing those puzzles here: Notes on building debugging puzzles. (You might notice that post is from a year and half – that’s because I’ve been trying to write this zine on and off for 3 and a half years and a lot of things happened along the way :))
it’s actually been helping me debug!
I’ve actually been shocked by how useful this zine has been for helping me debug – after all, I know all these strategies! I like to think I’m pretty good at debugging!
But when I’m in the middle of a tricky bug and I’m frustrated, I’ve actually been finding it incredibly helpful to reach for the table of contents and get an idea for something to try.
It’s also been fun to reflect on what strategies I’m using when debugging. For example, yesterday I had a CSS bug, and I was super frustrated. But it turned that I just needed to:
- come up with one small question
- write a tiny program
- start writing a message asking for help
- quickly read the docs
- delete the message I started writing without sending it, since I’d figured it out :)
some blog posts I wrote along the way
Here are a few blog posts I wrote while thinking about how to write this zine:
- a debugging manifesto
- some ways to get better at debugging
- reasons why bugs might feel “impossible”
- when debugging, your attitude matters
- what does debugging a program look like?
you can get a print copy shipped to you!
There’s always been the option to print the zines yourself on your home printer.
But this time there’s a new option too: you can get a print copy shipped to you! (just click on the “print version” link on this page)
The only caveat is print orders will ship around the end of January – I need to wait for orders to come in to get an idea of how many I should print before sending it to the printer.
the home printing directions are a little bit different!
This zine is twice the length of other zines, but half the height! This makes it extremely pocket sized, and it means you have to cut the print version in half. But don’t worry – there’s a dotted line and a video :)
The video with the print directions is at https://wizardzines.com/print/
the hardest part of writing this zine: making it specific
It’s relatively easy to give high-level debugging advice. Reproduce the bug! Be rigorous! Try to divide the problem space in half! Print stuff out! And this zine started out as pretty general high-level advice. (you can read a old table of contents here from an earlier draft)
Turning those high-level guidelines into specific things that you can actually do was a lot harder. I sat down with my amazing friend Marie Claire LeBlanc Flanagan every weekday at 10am for 6 months, and every day we made the zine a little more specific and concrete and useful.
I’m really proud of how it turned out.
beta readers are amazing
Also, I want to thank the beta readers – 40 of you read the zine and left comments about what was confusing, what was working, and ideas for how to make it better. It made the end product so much better.
thank you
As always: if you’ve bought zines in the past, thank you for all your support over the years. I couldn’t do this without you. Happy holidays.
A debugging manifesto
Hello! I’ve been working on a zine about debugging for the last 6 months with my friend Marie, and one of the problems we ran into was figuring out how to explain the right attitude to take when debugging.
We ended up writing a short debugging manifesto to start the zine with, and I’m pretty happy with how it came out. Here it is as an image, and as text (with some extra explanations)
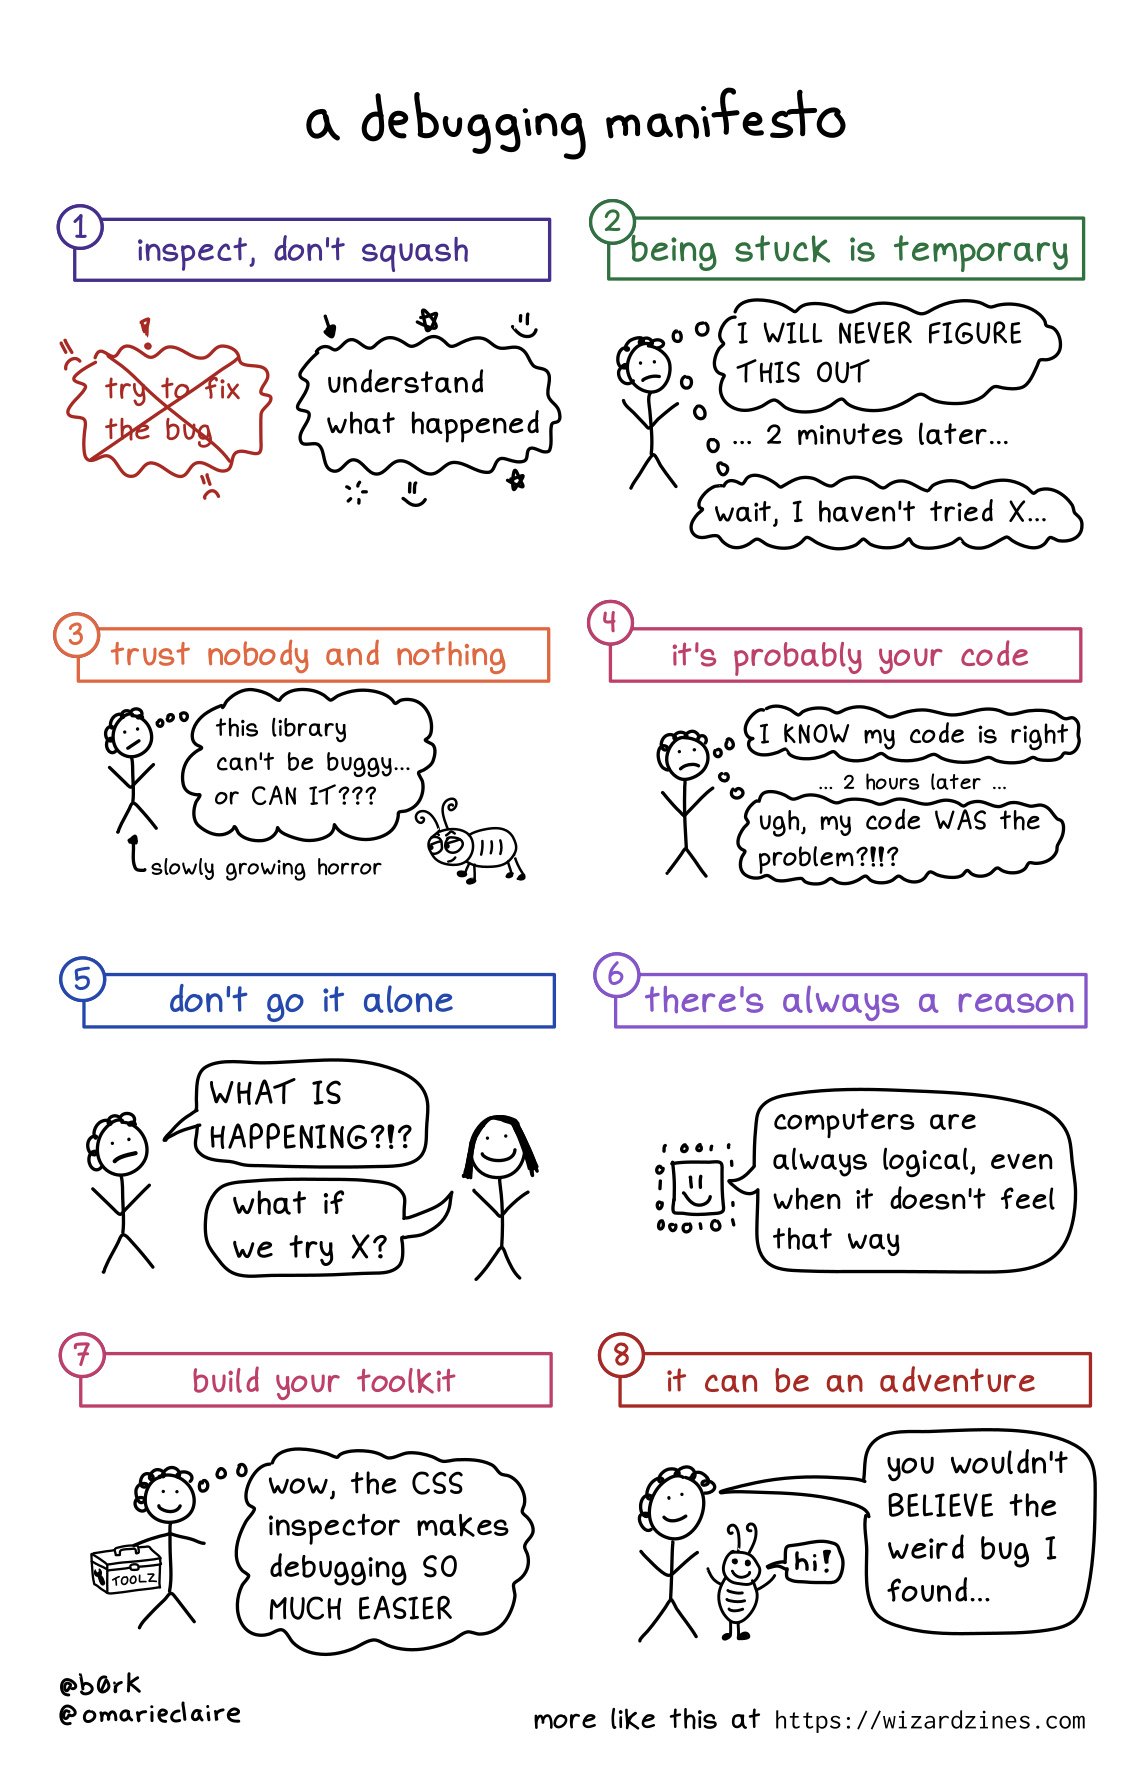
1. Inspect, don’t squash
When you run into a bug, the natural instinct is to try to fix it as fast as possible. And of course, sometimes that’s what you have to do – if the bug is causing a huge production incident, you have to mitigate it quickly before diving into figuring out the root cause.
But in my day to day debugging, I find that it’s generally more effective (and faster!) to leave the bug in place, figure out exactly what’s gone wrong, and then fix it after I’ve understood what happened.
Trying to fix it or add workarounds without fully understanding what happened usually ends up just leaving me more confused.
2. Being stuck is temporary
Sometimes I get really demoralized when debugging and it feels like I’ll NEVER make progress.
I have to remind myself that I’ve fixed a lot of bugs before, and I’ll probably fix this one too :)
3. Trust nobody and nothing
Sometimes bugs come from surprising sources! For example, in I think I found a Mac kernel bug? I describe how, the first time I tried to write a program for Mac OS, I had a bug in my program that was caused by a Mac OS kernel bug.
This was really surprising (usually the operating system is not at fault!!), but sometimes even normally-trustworthy sources are wrong. Even it’s a popular library, your operating system, the official documentation, or an extremely smart and competent coworker!
4. It’s probably your code
That said, almost all of the time the problem is not “there’s a bug in Mac OS”. I can only speak for myself, but 95% of the time something is going wrong with my program, it’s because I did something silly.
So it’s important to look for the problem in your own code first before trying to blame some external source.
5. Don’t go it alone
I’ve learned SO much by asking coworkers or friends for help with debugging. I think it’s one of the most fun ways to collaborate because you have a specific goal, and there are tons of opportunities to share information like:
- how to use a specific debugging tool (“here’s how to use GDB to inspect the memory here….”)
- how a computer thing works (“hey, can you explain CORS?”)
- similar past bugs (“I’ve seen this break in X way in the past, maybe it’s that?”)
6. There’s always a reason
This one kind of speaks for itself: sometimes it feels like things are just randomly breaking for no reason, but that’s never true.
Even if something truly weird is happening (like a hardware problem), that’s still a reason.
7. Build your toolkit
I’ve written a LOT about my love for debugging tools like tcpdump, strace, and more on this blog.
To fix bugs you need information about what your program is doing, and to get that information sometimes you need to learn a new tool.
Also, sometimes you need to build your own better tools, like by improving your test suite, pretty printing, etc.
8. It can be an adventure
As you probably know if you’re a regular reader of this blog, I love debugging and I’ve learned a lot from doing it. You get to learn something new! Sometimes you get a great war story to tell! What could be more fun?
I really think of debugging as an investment in my future knowledge – if something is breaking, it’s often because there’s something wrong in my mental model, and that’s an opportunity to learn and make sure that I know it for next time.
Of course, not all bugs are adventures (that off-by-one error I was debugging today certainly did not feel like a fun adventure). But I think it’s important to (as much as you can) reflect on your bugs and see what you can learn from them.